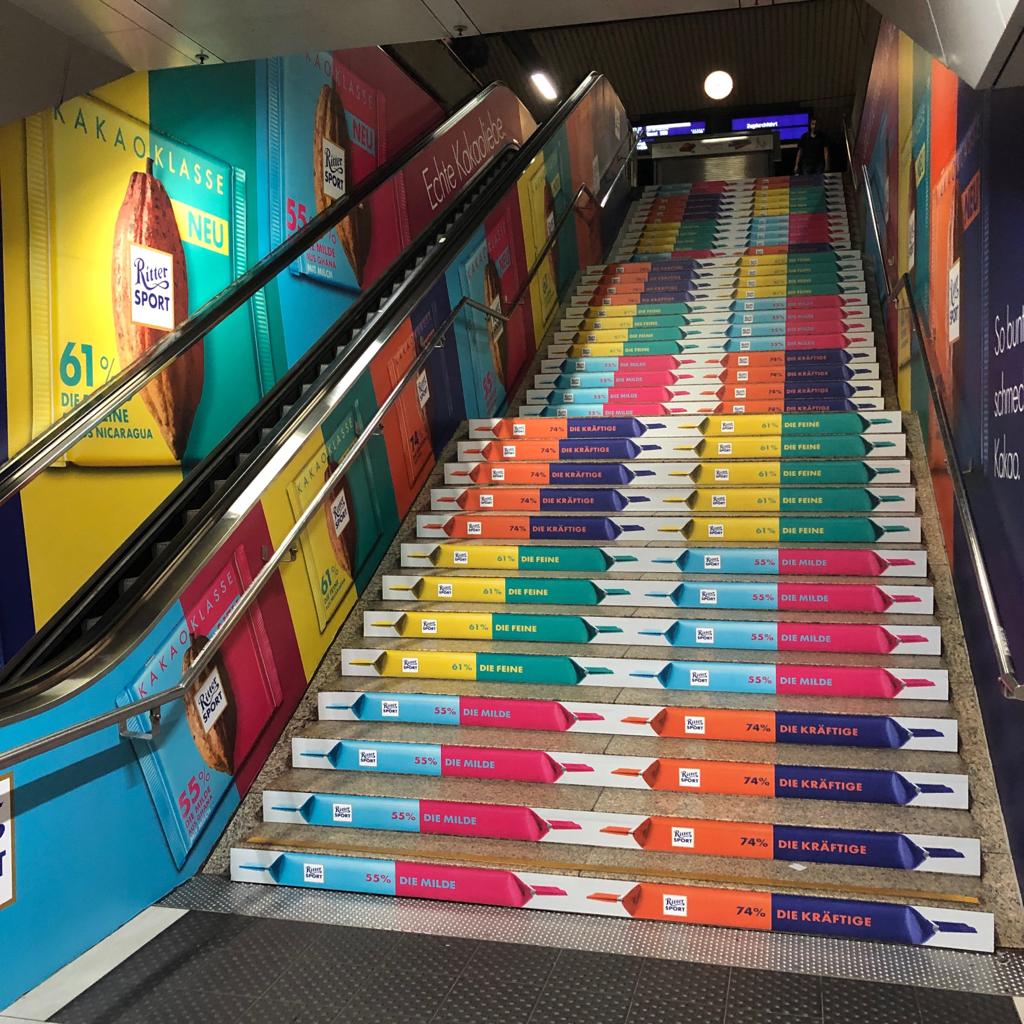
Techniques for assessing how well your event graphics are performing and their impact on your event’s success.
Event graphics are crucial for creating a memorable and engaging experience for attendees. However, it’s equally important to measure the effectiveness of these graphics to understand their impact on your event’s success. This guide will provide techniques for assessing how well your event graphics are performing.
1. Set Clear Objectives
Before you can measure the effectiveness of your event graphics, you need to establish clear objectives. These objectives should align with your overall event goals and could include:
- Brand Awareness: Increase brand visibility and recognition.
- Engagement: Encourage attendee interaction and participation.
- Conversions: Drive sales, sign-ups, or other specific actions.
- Impressions: Reach a large audience and leave a lasting impression.
2. Use Surveys and Feedback Forms
One of the most direct ways to measure the effectiveness of your event graphics is through attendee feedback.
- Post-Event Surveys: Send surveys to attendees asking specific questions about their impressions of the event graphics.
- Onsite Feedback Forms: Provide feedback forms at the event for immediate reactions.
- Focus Groups: Conduct focus groups with a sample of attendees to gain deeper insights into their perceptions.
3. Analyze Social Media Engagement
Social media is a powerful tool for measuring the reach and impact of your event graphics.
- Hashtag Tracking: Monitor the usage of event-specific hashtags to gauge how much your graphics are being shared and discussed.
- Engagement Metrics: Track likes, shares, comments, and mentions related to your event graphics.
- Sentiment Analysis: Use tools to analyze the sentiment of social media posts to understand how people feel about your graphics.
4. Monitor Attendee Interaction
Observe how attendees interact with your event graphics during the event.
- Heat Maps: Use heat mapping technology to see which areas of your event space attract the most attention.
- Foot Traffic: Measure foot traffic around your graphic displays to determine their draw.
- Interaction Tracking: Track the usage of interactive elements like QR codes or AR features embedded in your graphics.
5. Measure Conversions and ROI
Assess the direct impact of your event graphics on your business objectives.
- Lead Generation: Track the number of leads generated through your graphics, such as sign-ups or inquiries.
- Sales Data: Analyze sales data to see if there’s a spike during or after the event that can be attributed to your graphics.
- ROI Calculation: Calculate the return on investment (ROI) by comparing the cost of your event graphics to the revenue generated as a result.
6. Utilize Technology and Analytics Tools
Leverage technology to gain detailed insights into the performance of your event graphics.
- Event Apps: Use event apps to track attendee engagement with digital graphics and interactive elements.
- Analytics Software: Implement analytics software to gather data on interactions, clicks, and other metrics.
- RFID and Beacons: Use RFID and beacon technology to track attendee movements and interactions with your graphics.
7. Conduct Competitor Analysis
Compare your event graphics with those of competitors to understand industry standards and identify areas for improvement.
- Benchmarking: Benchmark your graphics against industry leaders to see where you stand.
- Best Practices: Analyze successful competitor graphics to glean best practices and innovative ideas.
- Attendee Feedback: Gather feedback on competitor graphics from attendees who have been to multiple events.
8. Review and Adjust
After collecting and analyzing the data, review the results to identify strengths and areas for improvement.
- Identify Trends: Look for trends in the data to understand what works and what doesn’t.
- Make Adjustments: Based on the insights gained, make necessary adjustments to your graphics strategy.
- Continuous Improvement: Implement a cycle of continuous improvement to enhance the effectiveness of your event graphics over time.
Conclusion
Measuring the effectiveness of your event graphics is essential for ensuring they contribute to your event’s success. By setting clear objectives, gathering feedback, analyzing social media engagement, monitoring interaction, measuring conversions, utilizing technology, conducting competitor analysis, and making adjustments, you can gain valuable insights and continuously improve your graphics strategy.
EventGraphics is the partner you need to create and measure the impact of your event graphics. With our expertise in designing and evaluating effective graphics, we ensure your event stands out and achieves its goals. Trust EventGraphics – The Event Graphic Specialists to deliver exceptional designs and insightful analysis for your next event. Contact us today to discover how we can enhance your event graphics strategy.

